
Migareference Stats
Migareference stats is a robust system crafted to collect and analyze the referrer’s statistics. The Side Menu Module is a powerful feature that delivers detailed insights into essential metrics like the total number of referrers, performance of referrer ratings of the referrers, reports submitted, no of deals, commission paid/pending, and success rate. This data is displayed through visually engaging graphs, Tables ensuring a user-friendly interface for efficient statistical analysis.
Users can download the report in the form of a PDF when click on![]() it.
it.

1. GENERAL STATS
The stats that explain the overall statistics analysis of the App like the number of Referrers
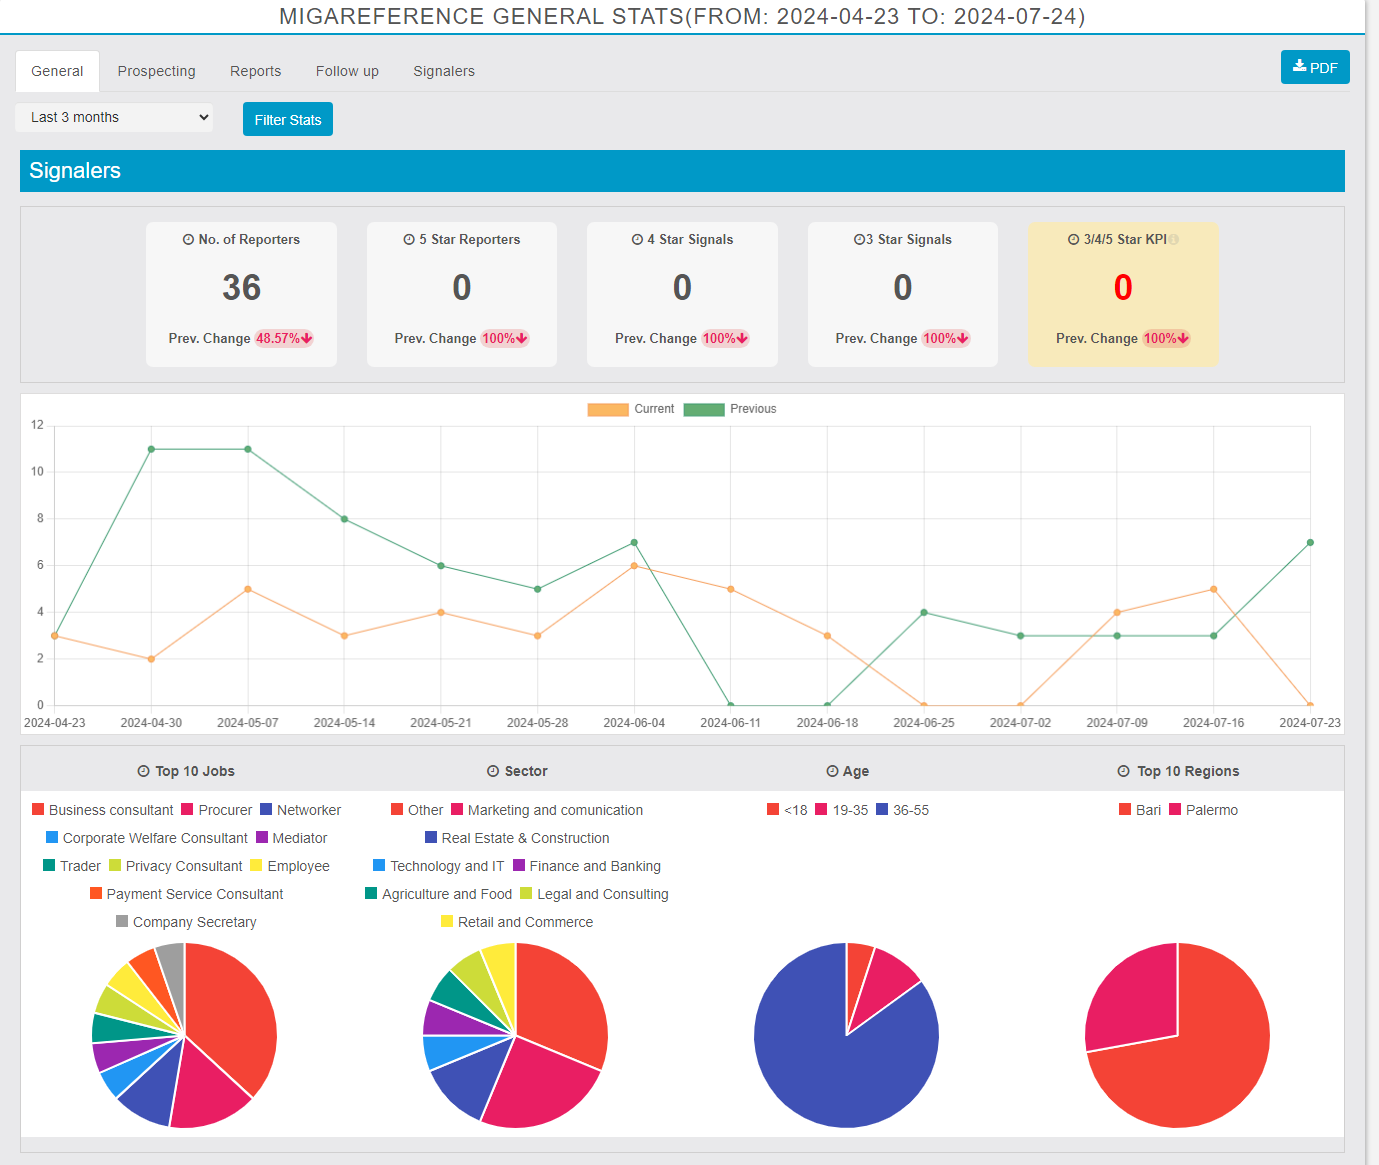
REFERRER
- Time Filter/custom Range: When we select a time range we filter the records by creation date. We also compare the records vs. the previously same period creation date. This
is valid on all charts. - Widget: Recruitment quality indicator. Good recruitment must produce at least 0.15 (15%) good Referrers if the value is below 0.15 mark it as red.
- Comparison chart (LINE & PI): We have Two lines: Current and Previous period. Variation in % is shown only if we select LAST 30 DAYS, PAST MONTH, PAST 3 MONTHS, PAST 6 MONTHS, and CURRENT YEAR. Variation is the difference in % between a given time range and the previously same time range (Ex. last 30 days vs last 60-30 days). Provide the statistics as a PI chart for fields like job, sector, age, and region with the percentage of specific field colors.
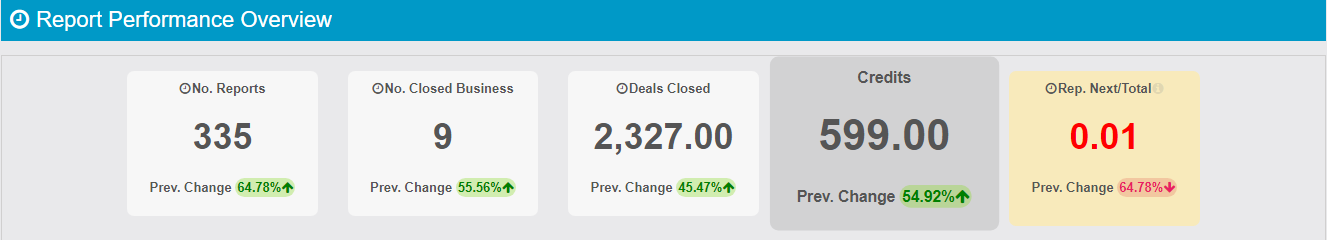
REPORT PERFORMANCE OVERVIEW
The part of General stats that gives the statistical analysis of Report performance as shown in fig number of report, no of closed business, deal closed, and credits.
The indicator shows No. Deals = Number of Reports in status AGREEMENT SIGNED. If the value is less than 0.20 is in RED “Report quality indicator. If the conversion into
sales fall below 0.20 (20%) it means that the
Referrers are not referring target people.”
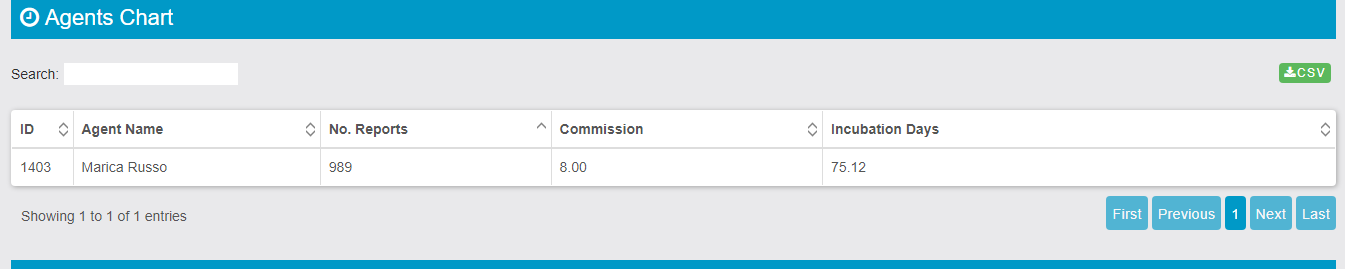
AGENT CHART
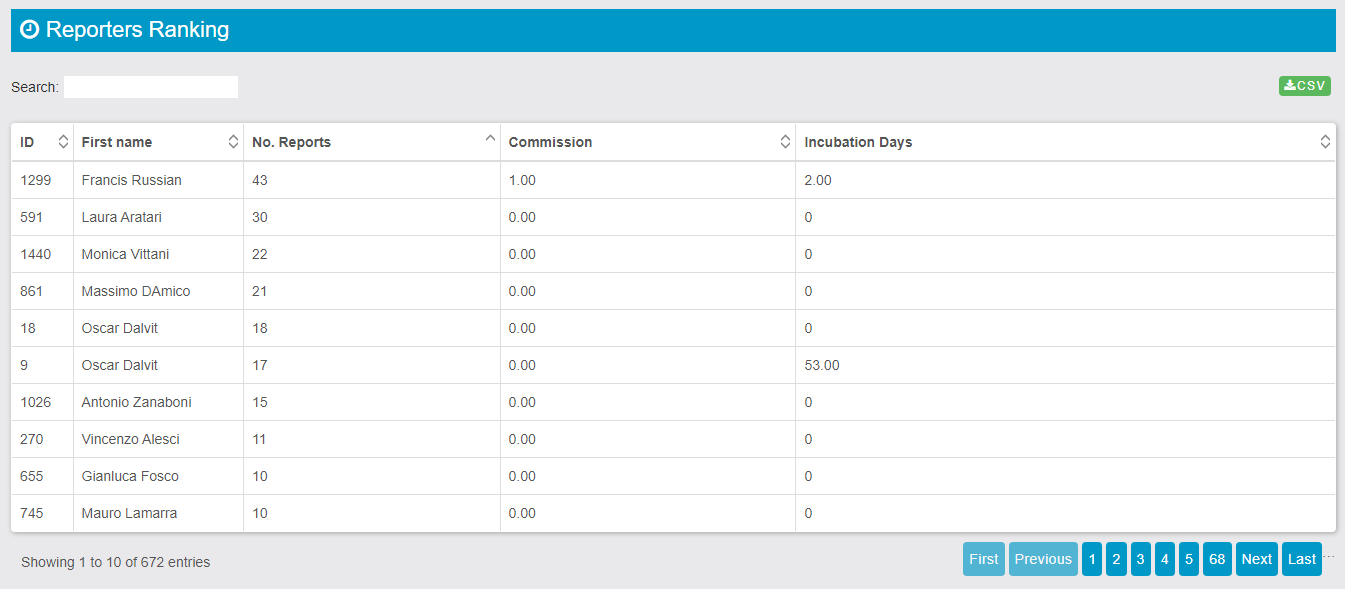
REPORTERS RANKING
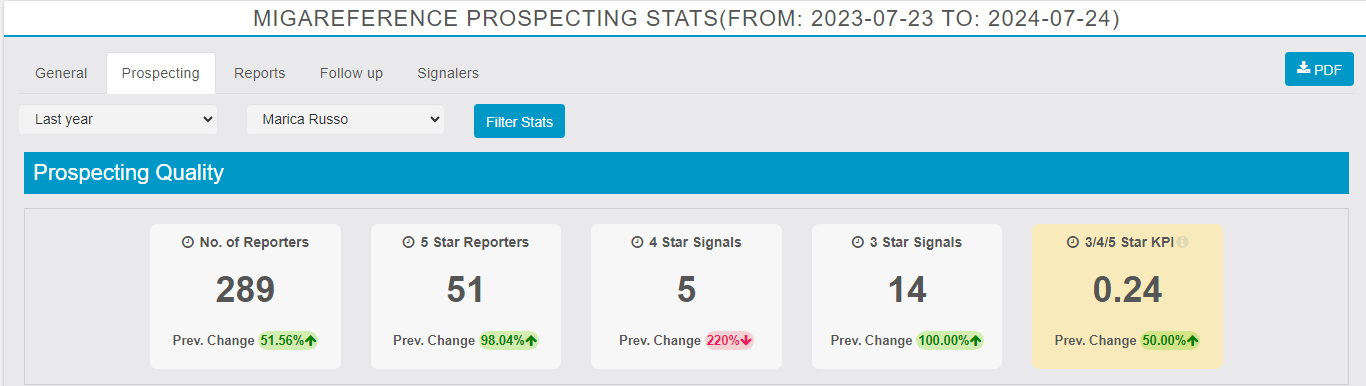
2. PROSPECTING
Prospecting is a vital activity to ensure a continuous flow of potential clients and contacts. It serves as the foundation for maintaining a robust network and fostering relationships that can lead to business growth.
When we select a time range we filter the records by creation date. And we compare the records vs the previously same period creation date. This is valid on all charts
Prospecting quality:
To measure the effectiveness of prospecting efforts, profiles are counted based on the following criteria (PROCESSED REFERRERS):
- A change in rating
- The first entry in the Relational Notes field
- The first entry in the Reciprocity Notes field
- 3-5 Stars KPI is TOTAL REFERRERS 3-4-5 STARS divided TOTAL REFERRERS If the value is less than 0.15 we show in RED the total
- Recruitment quality indicator. Good recruitment must produce at least 0.15 (15%) good referrer
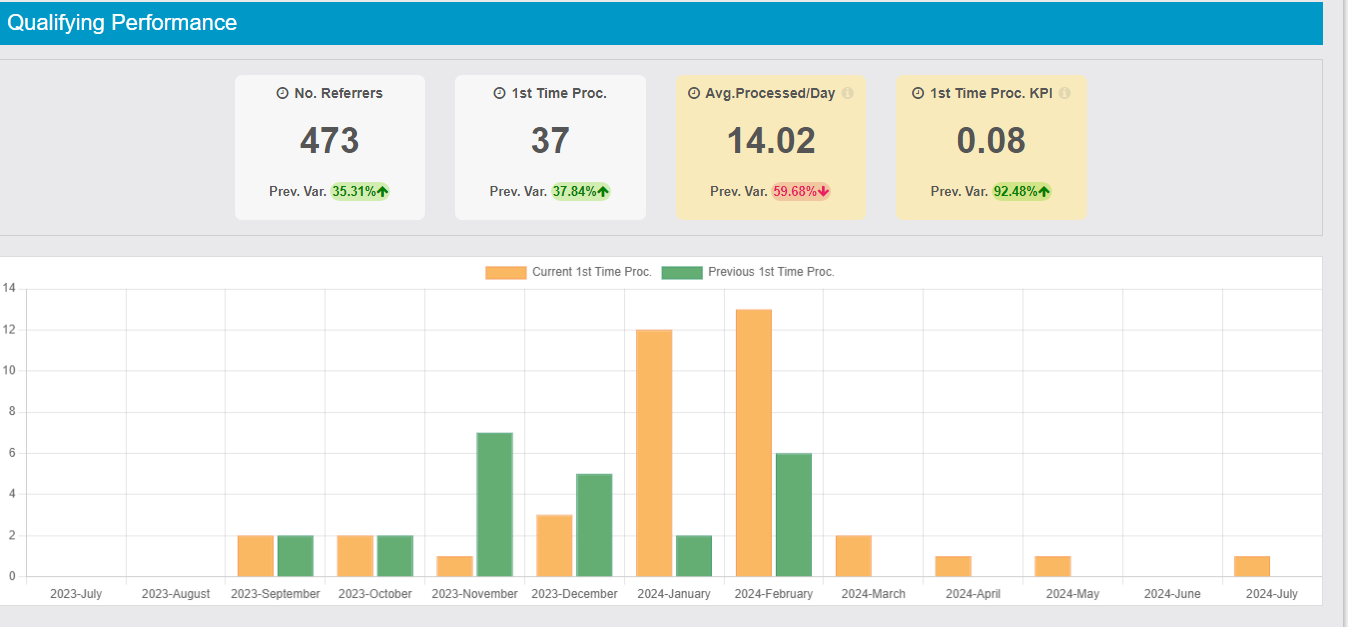
Qualifying Performance
Performance statistics show no referer performed, and the first time processed report the Widget explains that Qualifying and knowing potential referrers is very important. The minimum average daily number must not fall below 2. Knowing and qualifying your referrers is essential.
This KPI tells you how many people you managed to get to know and profile in your club.
- We have A Pills chart for the Current and Previous periods with all the daily results for the given time range.
- One Widget with TOTAL PROCESSED.
- One Widget with AVG./DAY (working days, look on general settings)
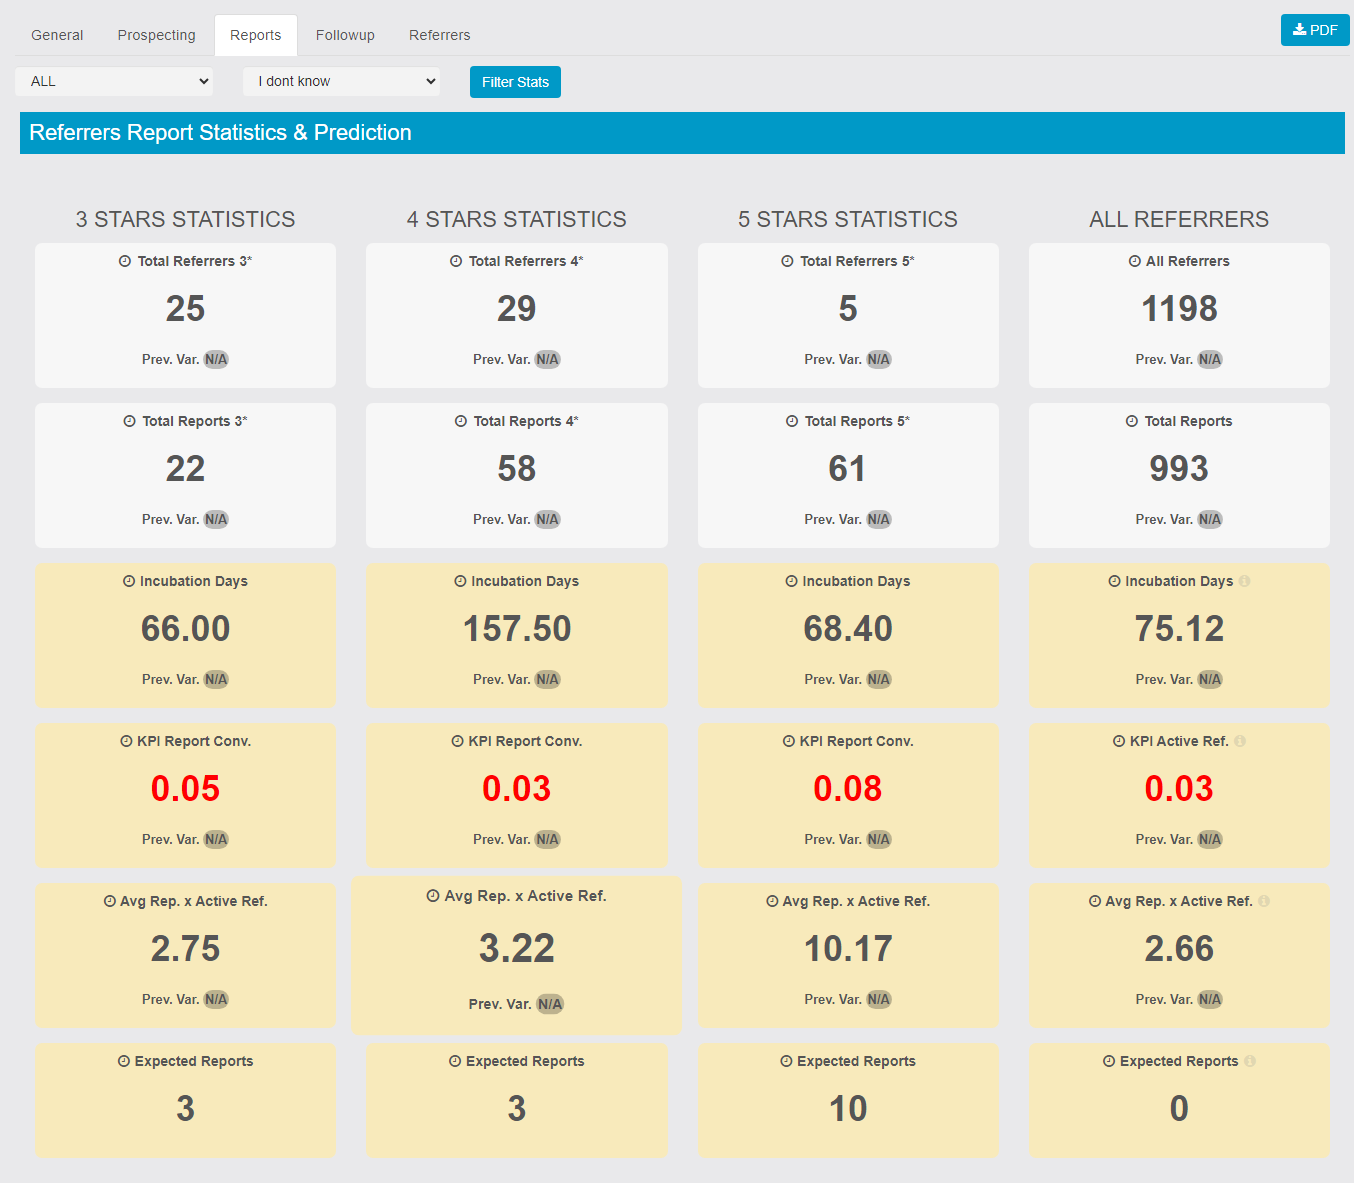
3. REPORTS
The stats provide the statistical information of all reports submitted, processed, incubation days, KPIs widgets, and expected reports.
- Incubation days is the average number of days between the registration of a Referrer and the sending of the first report. This KPI measures the e! effectiveness of training and the quality of the Referrer.
- KPI measures how many of our Referrers make a first-time report. The value should always be greater than 0.15. This KPI measures the effectiveness of training and the quality of Referrers.
- Avg Rep. x Active Ref This KPI measures the total number of reports received from referrers
in the same group, divided by the total number of reporters who have made at least one report. The KPI measures how active the reporters are over time and therefore the effectiveness of the follow-up. - Expected Reports is the KPI that tries to predict how many reports we will owe in the near future. The calculation takes into consideration the percentage of Referrers that will be activated, therefore Total Referrers not yet active x the KPI Active Referrers. The calculation only takes into account alerts created between today and twice the average incubation time
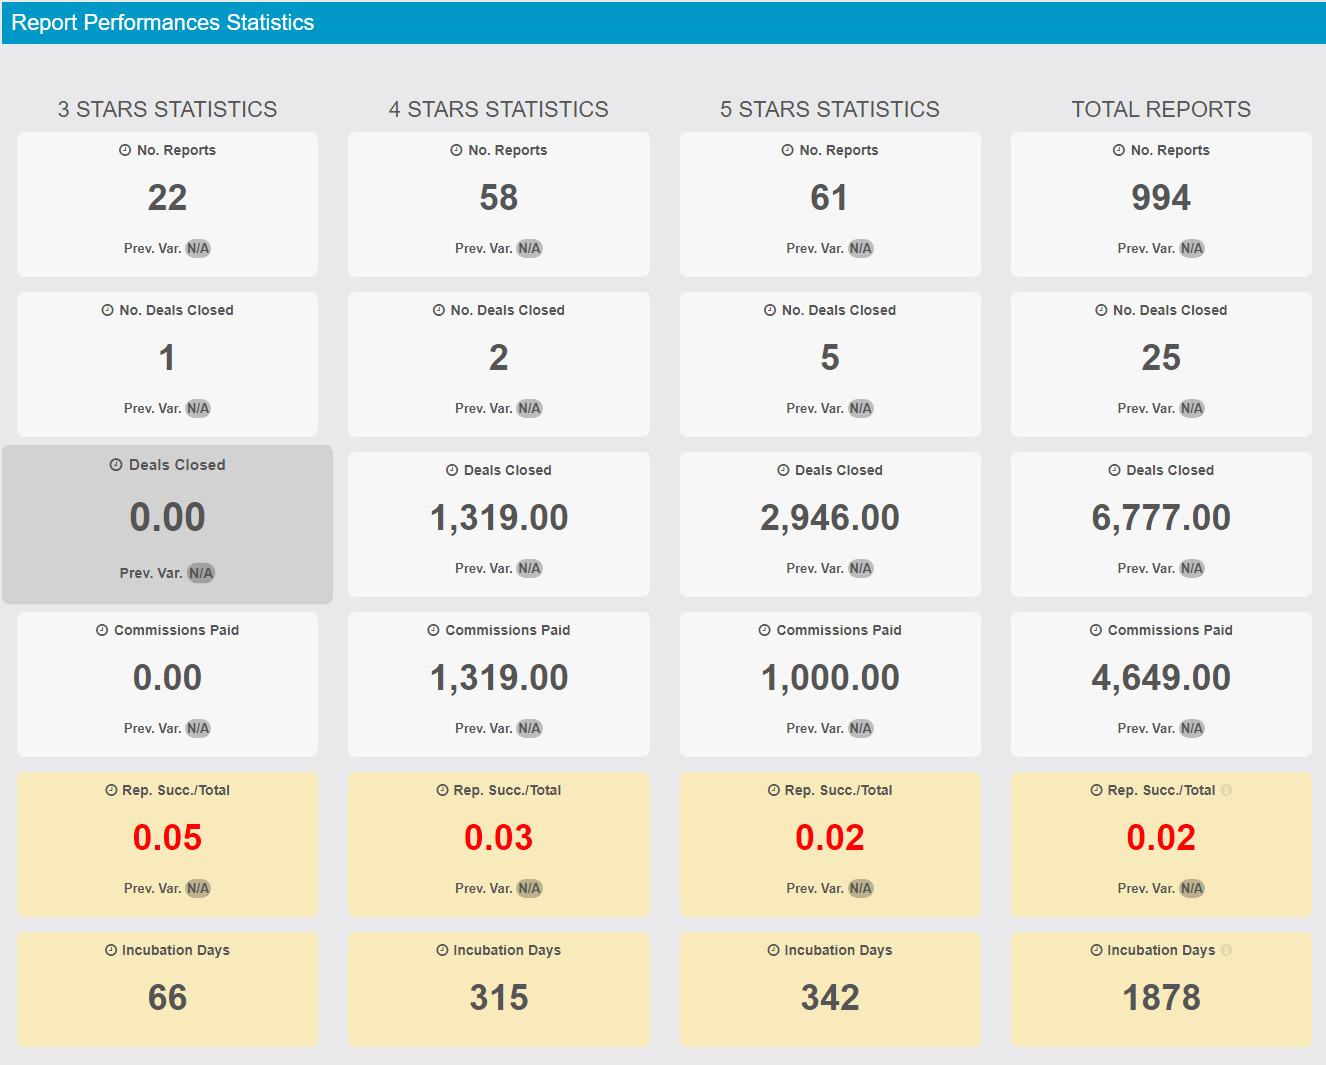
Report Performances Statistics
Rating-based performance stats of reports also explain the statistical info of no deals closed and commission paid.
- Rep. Succ./Total widget shows the report quality indicator. If the conversion into sales falls below 0.20 (20%) it means that the Referrers are not referring target people.
- The incubation time tells us how long on average a report takes to conclude with a sale.
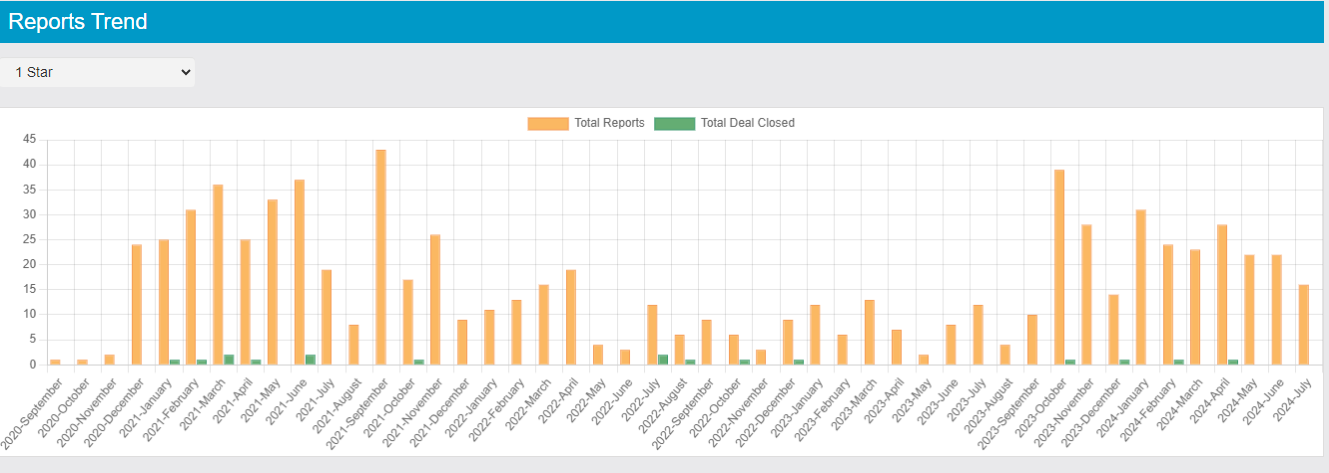
Reports Trend
Two pills per day/week/month, one is showing Total Reports (Orange) and one is showing Total Deal Closed (Green) (Mandate Acquired). Users can filter the pill chart rating-wise.
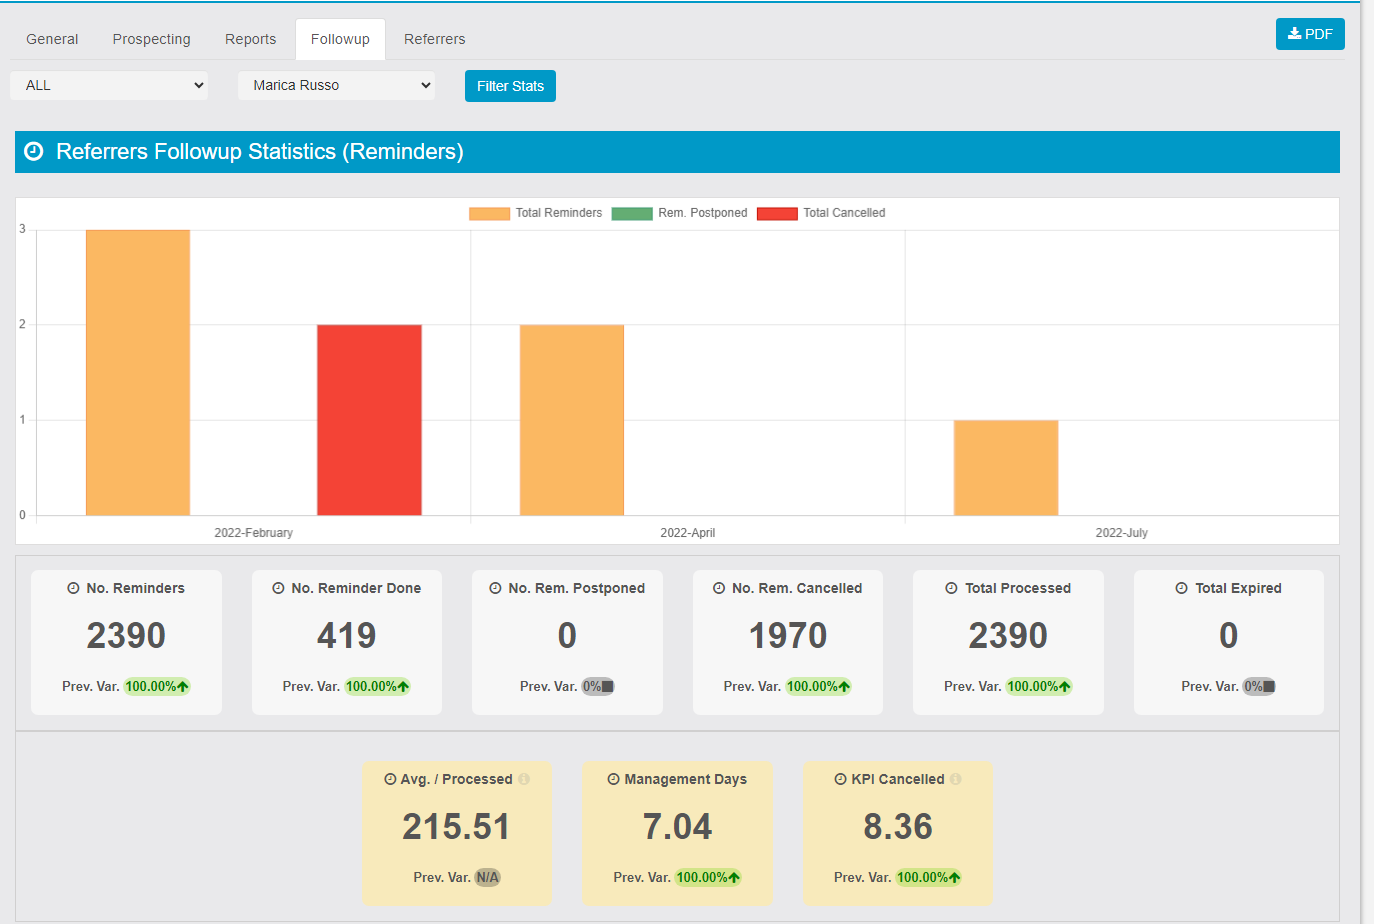
4. REFERRER FOLLOWUP STATISTICS (Reminders)
This tab explains the reminder statistics on how many no of reminders are delivered, pending reminders, and canceled.
- the pill chart has 3 pills per day/week/month, one is showing Total Reminders (Yellow), one is showing Total Reminder Postponed (Orange) and one is showing Total Reminders Cancelled (Red).
- Avg / Processed is the total reminders handled in the period per working day.
- KPI Cancelled is the indicator that allows us to understand how many reminders have been discarded and not worked on. The KPI should be as close to 0 as possible.
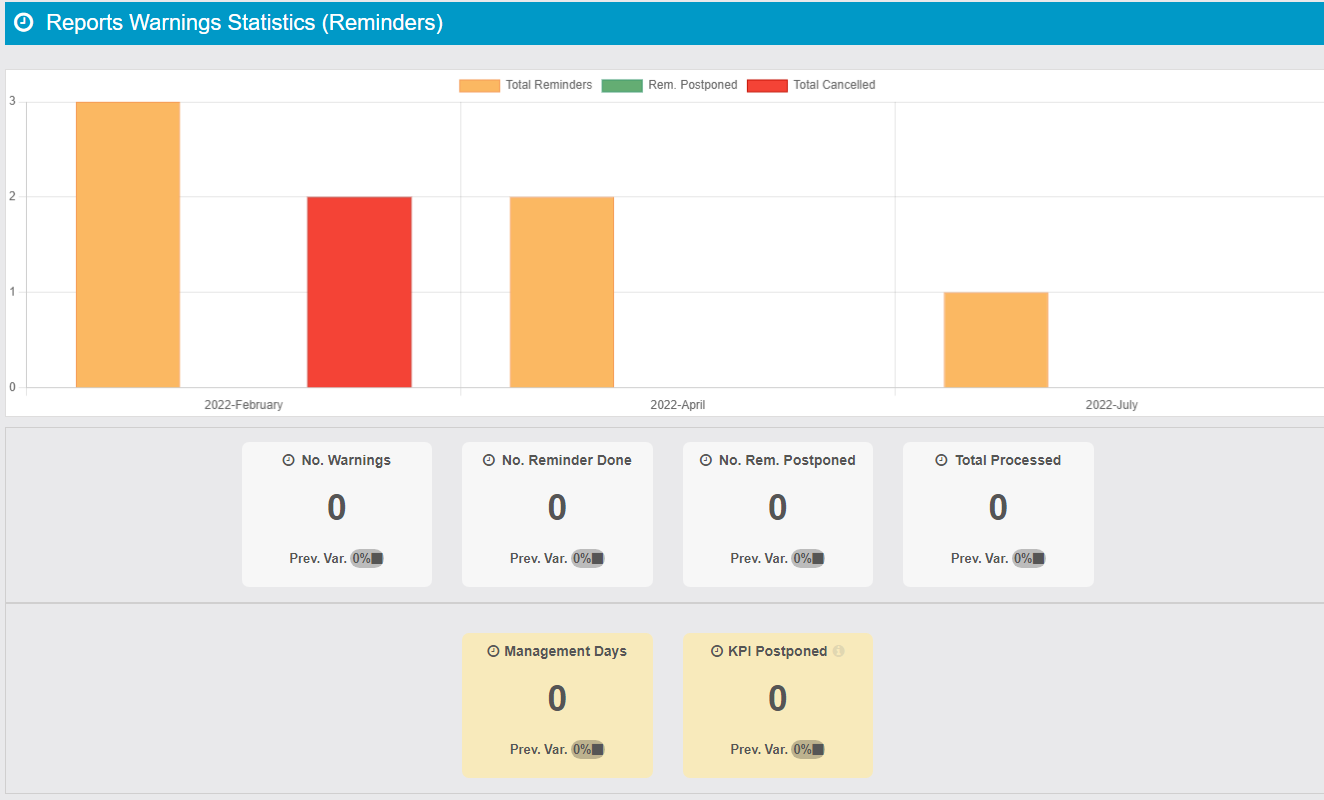
Reports Warnings Statistics (Reminders)
- 3 pills per day/week/month, one is showing Total Reminders (Yellow), one is showing Total Deal Postponed (Orange) and one is showing Total Reminders Cancelled (Red).
- This KPI measures total issue reminders on Snoozed References divided by total issues. This KPI should be close to 0
link: https://support.migastone.com/en/hrf_faq/migastats-v2/